
Troubleshooting Pipelines Guide
This document describes common issues with IRIDA pipelines and how to resolve them.
- 1. Types of IRIDA job errors
- 2. Finding the Galaxy History used by an IRIDA pipeline
- 3. Viewing the Galaxy History used by the IRIDA analysis pipeline
- 4. Viewing additional Galaxy job information
- 5. Rerunning Galaxy jobs
- 6. Examples
When encountering an analysis pipeline error, the first step to troubleshooting is to figure out what sort of error was encountered. There are two types of errors that can occur: error with detailed information, and error with no detailed information.
1. Types of IRIDA job errors
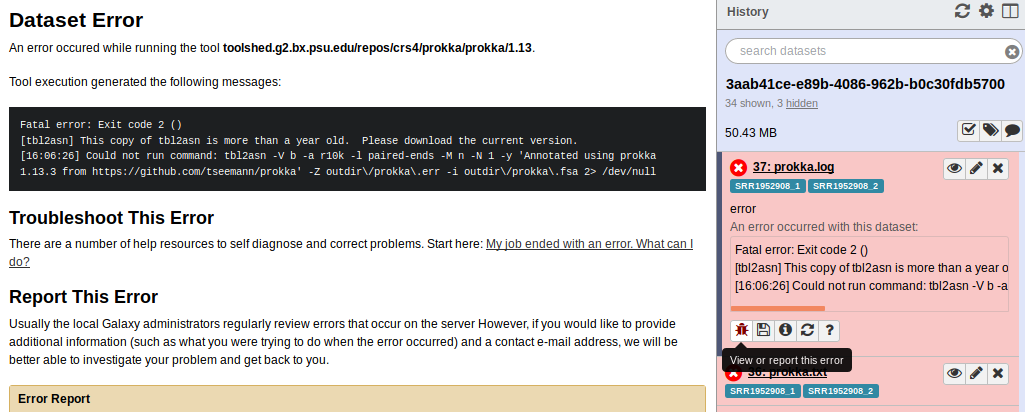
1.1. Error with detailed information
This occurs when one of the Galaxy tools in the workflow reported an error and will show up with the status Error and a question mark ? for more details. The stderr/stdout of the tool will be available in the preview.
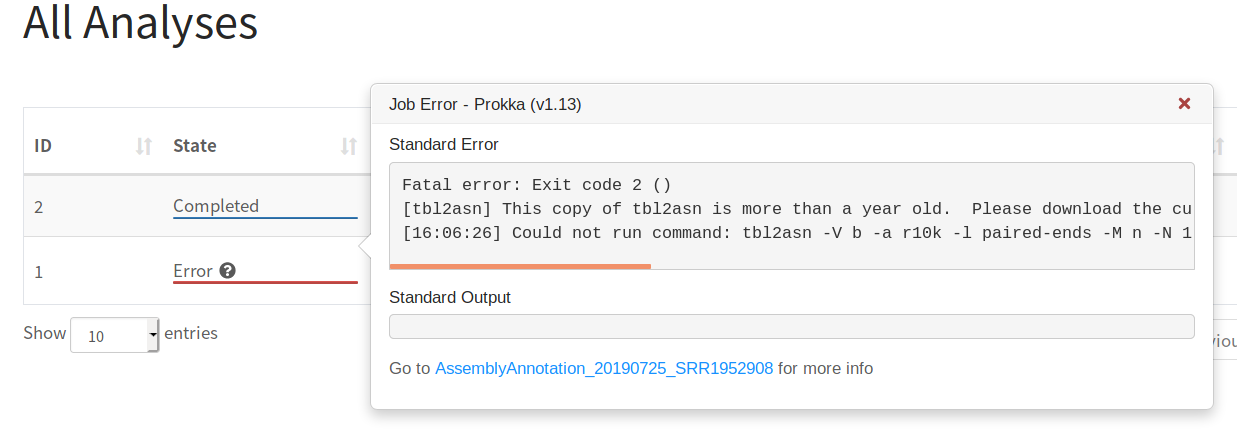
Additional details will be available after clicking on the job:
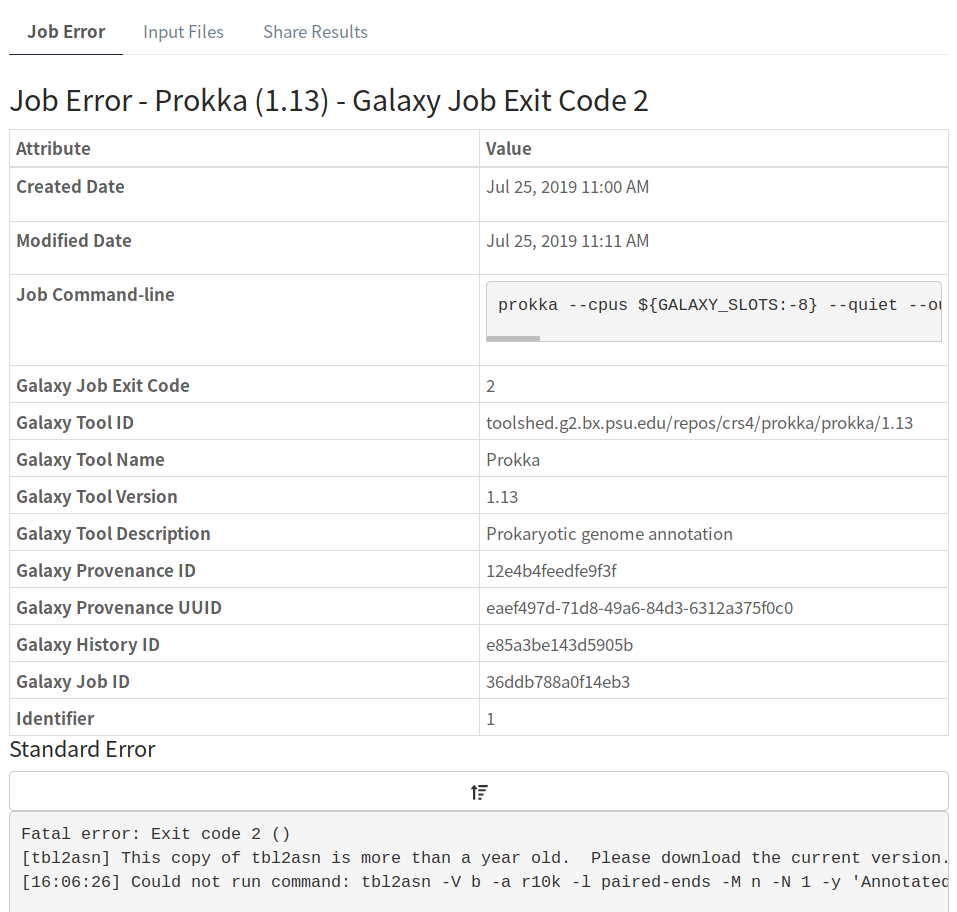
Here, we get the exact tool Prokka and version 1.13 that is causing the error, along with additional details about the Galaxy instance where all these tools are being run.
1.2. Error with no detailed information
This occurs when there was an issue unrelated to a specific Galaxy tool (and so no detailed information can be obtained about a specific tool).
Examples where this error could occur include timeouts when transferring files to Galaxy or missing tools in Galaxy required by the pipeline. Normally, more details about these errors will be found in the IRIDA log file:
-
Timeout when uploading files to Galaxy
 25 Jul 2019 13:52:30,786 ERROR ca.corefacility.bioinformatics.irida.service.analysis.execution.AnalysisExecutionServiceAspect:65 - Error occured for submission: AnalysisSubmission [id=3, name=AssemblyAnnotation_20190725_SRR1952908, submitter=admin, workflowId=4673cf14-20eb-44e1-986b-ac7714f9a96f, analysisState=SUBMITTING, analysisCleanedState=NOT_CLEANED] changing to state ERROR
ca.corefacility.bioinformatics.irida.exceptions.UploadTimeoutException: Timeout while uploading, time limit = 2 seconds
     at ca.corefacility.bioinformatics.irida.pipeline.upload.galaxy.GalaxyLibrariesService.filesToLibraryWait(GalaxyLibrariesService.java:245)
     at ca.corefacility.bioinformatics.irida.pipeline.upload.galaxy.GalaxyHistoriesService.filesToLibraryToHistory(GalaxyHistoriesService.java:201)
     ...
     at java.lang.Thread.run(Thread.java:748)
Caused by: java.util.concurrent.TimeoutException
     at java.util.concurrent.FutureTask.get(FutureTask.java:205)
     at ca.corefacility.bioinformatics.irida.pipeline.upload.galaxy.GalaxyLibrariesService.filesToLibraryWait(GalaxyLibrariesService.java:241)
     ... 28 more
A quick solution for this particular error would be to increase the timeout limit for uploading files to Galaxy for pipelines (in this case, set low at 2 seconds). This can be done by setting
galaxy.library.upload.timeout=2to some larger number in the/etc/irida/irida.conffile and restarting IRIDA. -
Missing tools in Galaxy
 25 Jul 2019 14:16:16,393 ERROR ca.corefacility.bioinformatics.irida.service.analysis.execution.AnalysisExecutionServiceAspect:65 - Error occured for submission: AnalysisSubmission [id=4, name=AssemblyAnnotation_20190725_SRR1952908, submitter=admin, workflowId=4673cf14-20eb-4
4e1-986b-ac7714f9a96f, analysisState=SUBMITTING, analysisCleanedState=NOT_CLEANED] changing to state ERROR
ca.corefacility.bioinformatics.irida.exceptions.WorkflowException: GalaxyResponseException{status=400, responseBody={"err_msg": "Tool toolshed.g2.bx.psu.edu/repos/iuc/quast/quast/5.0.2 missing. Cannot add dummy datasets.", "err_code": 400014}, errorMessage=Tool toolshed.g2.b
x.psu.edu/repos/iuc/quast/quast/5.0.2 missing. Cannot add dummy datasets., errorCode=400014, traceback=null}
     at ca.corefacility.bioinformatics.irida.pipeline.upload.galaxy.GalaxyWorkflowService.runWorkflow(GalaxyWorkflowService.java:123)
     at ca.corefacility.bioinformatics.irida.service.analysis.execution.galaxy.AnalysisExecutionServiceGalaxyAsync.executeAnalysis(AnalysisExecutionServiceGalaxyAsync.java:152)
     ...
     Caused by: GalaxyResponseException{status=400, responseBody={"err_msg": "Tool toolshed.g2.bx.psu.edu/repos/iuc/quast/quast/5.0.2 missing. Cannot add dummy datasets.", "err_code": 400014}, errorMessage=Tool toolshed.g2.bx.psu.edu/repos/iuc/quast/quast/5.0.2 missing. Cannot ad
d dummy datasets., errorCode=400014, traceback=null}
A quick solution for this issue would be to log into Galaxy and make sure the required tool (and version of the tool) is installed. In this case it would be
toolshed.g2.bx.psu.edu/repos/iuc/quast/quast/5.0.2.
In general, though, you may want to take a look at the specific Galaxy history used by this IRIDA analysis pipeline to run jobs.
2. Finding the Galaxy History used by an IRIDA pipeline
As mentioned in section (1), there are two types of errors that can occur in a pipeline: those with detailed information, and those without. Getting the Galaxy History used by the pipeline depends on which type of error you encounter. Once we have the Galaxy History id, we can log into Galaxy to find more information about what was going on with this particular jobs in this Galaxy history.
2.1. Getting Galaxy History when a job has error details
In this case, it’s pretty straightforward to get the Galaxy History id, it’s displayed in the error details.
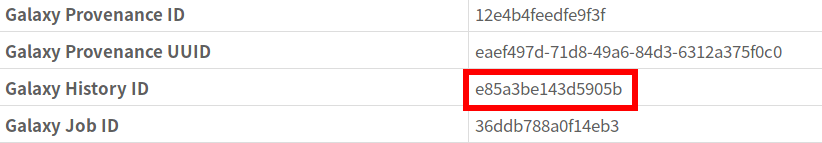
This tells us that the Galaxy History ID used by this pipeline is e85a3be143d5905b.
2.2. Getting Galaxy History when job has no error details
In this case, it’s a bit more difficult to find the Galaxy History id. We will have to log into the IRIDA database to search for it.
2.2.1. Logging into the IRIDA database
If you log into the machine running the IRIDA instance, you can find the database connection details in the /etc/irida/irida.conf file. For example:
spring.datasource.url=jdbc:mysql://localhost:3306/irida_test
spring.datasource.username=test
spring.datasource.password=test
This tells us the database software is running on the machine localhost and we want to use the database named irida_test, with username test and password test.
To log into this database, you can run:
mysql -u test -p --host localhost --database irida_test
2.2.2. Finding the Galaxy History id
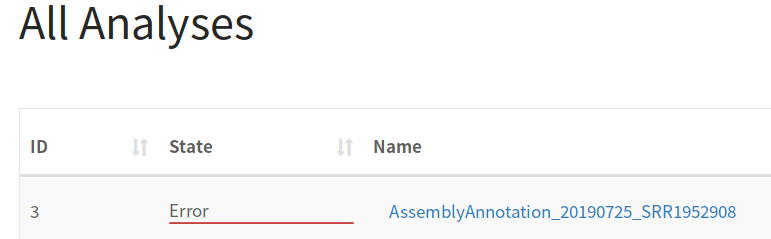
Once we’ve logged into the database, we can run a query to get the Galaxy History id, but first we need the IRIDA Analysis pipeline id. This can be found in the page listing the pipelines:
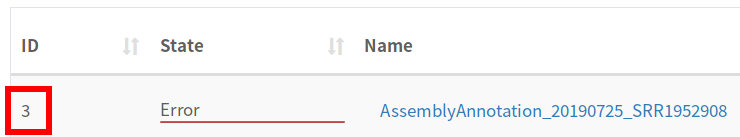
In this case, our job id is 3.
So, now back to the MySQL database query, we want to run:
SELECT id,name,analysis_state,remote_analysis_id FROM analysis_submission WHERE id = 3;
This should give us:
+----+----------------------------------------+----------------+--------------------+
| id | name                                   | analysis_state | remote_analysis_id |
+----+----------------------------------------+----------------+--------------------+
|  3 | AssemblyAnnotation_20190725_SRR1952908 | ERROR          | 2a56795cad3c7db3   |
+----+----------------------------------------+----------------+--------------------+
The field containing the Galaxy History id is remote_analysis_id (so the value we are looking for is 2a56795cad3c7db3).
2.2.3. What if the Galaxy History id is NULL
If this value is NULL, then it’s possible that the error occurred before a Galaxy History was created. You can get more information about the history of this IRIDA analysis pipeline execution from the audit tables (analysis_submission_AUD). Please try running:
SELECT id,name,analysis_state,modified_date,remote_analysis_id FROM analysis_submission_AUD WHERE id = 3;
+----+----------------------------------------+----------------+---------------------+--------------------+
| id | name                                   | analysis_state | modified_date       | remote_analysis_id |
+----+----------------------------------------+----------------+---------------------+--------------------+
|  3 | AssemblyAnnotation_20190725_SRR1952908 | NEW            | 2019-07-25 13:48:33 | NULL               |
|  3 | AssemblyAnnotation_20190725_SRR1952908 | PREPARING      | 2019-07-25 13:52:26 | NULL               |
|  3 | AssemblyAnnotation_20190725_SRR1952908 | PREPARED       | 2019-07-25 13:52:27 | 2a56795cad3c7db3   |
|  3 | AssemblyAnnotation_20190725_SRR1952908 | SUBMITTING     | 2019-07-25 13:52:27 | 2a56795cad3c7db3   |
|  3 | AssemblyAnnotation_20190725_SRR1952908 | ERROR          | 2019-07-25 13:52:30 | 2a56795cad3c7db3   |
+----+----------------------------------------+----------------+---------------------+--------------------+
This lets us see the history of the job as it was processed through IRIDA (and includes the modified_date giving an idea of when each stage occurred). You can see that the first two states NEW and PREPARING have a NULL value for remote_analysis_id. If the IRIDA pipeline errored in these states, there would not have been a Galaxy History created. So, you can skip trying to check the Galaxy History for more details about the job.
3. Viewing the Galaxy History used by the IRIDA analysis pipeline
3.1. Logging into Galaxy
Once we have the Galaxy History id, we can move on to logging into Galaxy to view more details about what went wrong with the IRIDA analysis pipeline. The first step is logging into Galaxy as the same user used by IRIDA.
Note: if you do not know which Galaxy instance IRIDA is making use of, you can find this in the /etc/irida/irida.conf file as galaxy.execution.url=http://GALAXY. You can find the username as galaxy.execution.email=galaxy-user@galaxy.org. IRIDA uses the Galaxy API to login, which is different from the password, so you may have to check with your administrator for the password used to log into Galaxy.
3.2. Viewing all Galaxy histories
Galaxy will default to one of the histories run by IRIDA. To see all the Galaxy histories, you can go to the Saved Histories page.
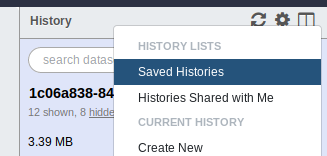
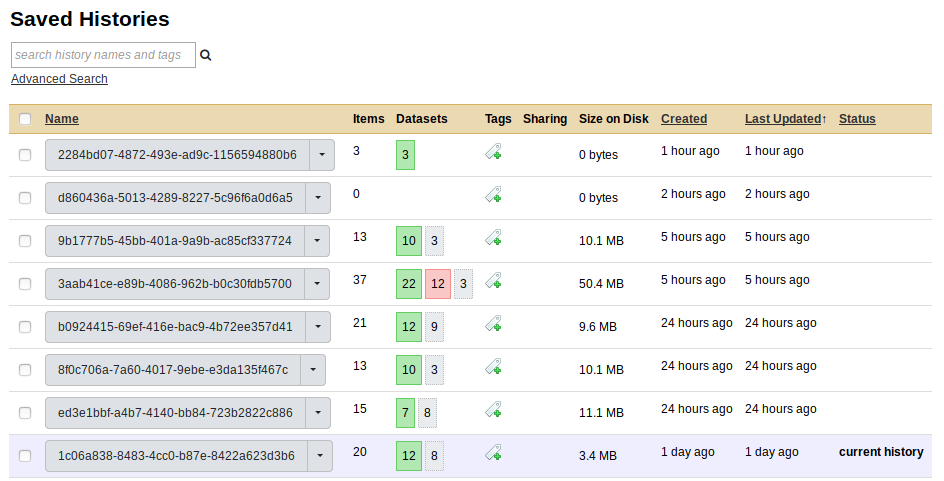
This should bring us to a list of all the Galaxy histories.
3.3. Viewing the correct history
To view the correct History in Galaxy, we can skip directly to it using the following URL http://GALAXY/histories/view?id=[Galaxy History id] Where Galaxy History id is the id we discovered from step 1.2 (e.g., e85a3be143d5905b). For example, for me, going to http://localhost:48888/histories/view?id=e85a3be143d5905b brings up:
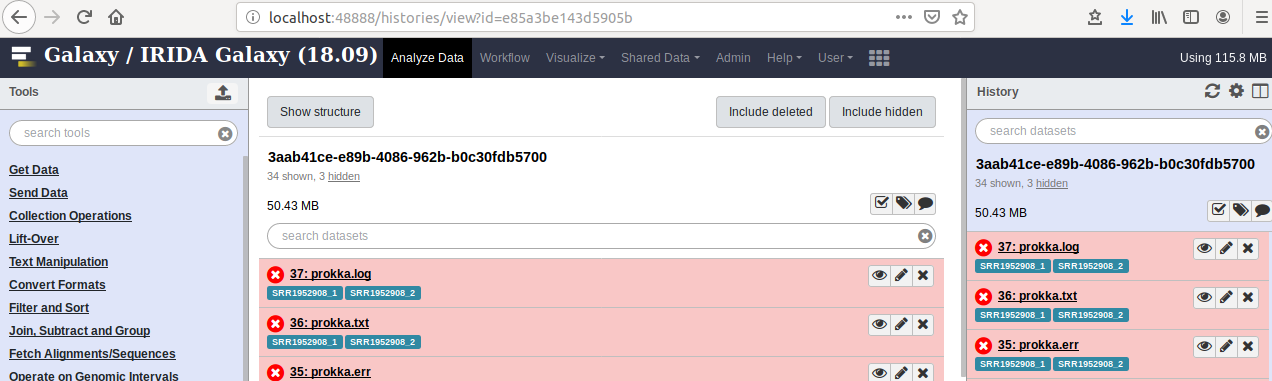
This is the History corresponding to the analysis pipeline in IRIDA that failed. I can now see all the failed jobs (in red). Clicking on the bug icon in one of these jobs will show me the error message (which in this case, is the same as was recorded by IRIDA).
Clicking the i icon gives me more information about the Galaxy job.
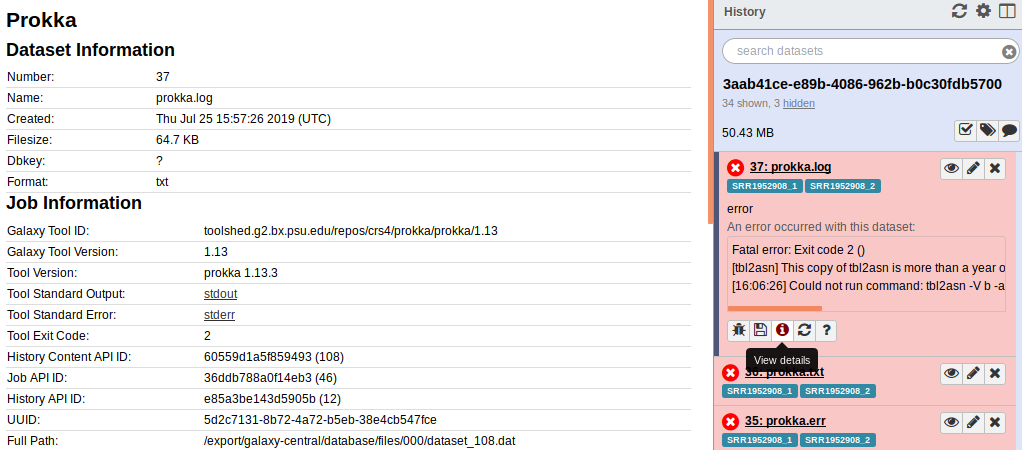
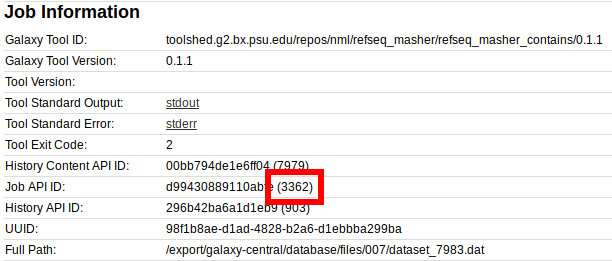
Scrolling to the bottom of this screen there is a lot of information about the underlying infrastructure and software:
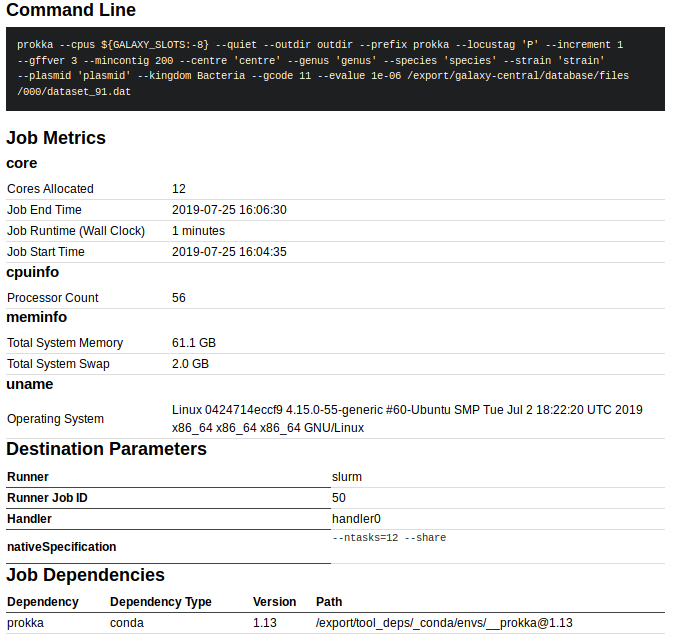
For example, this contains the exact command-line that was run, system resources uses, the Runner Job ID (in this case 50 which is the slurm job id if using slurm to run jobs), as well as the Path to the dependency software (in this case /export/tool_deps/_conda/envs/__prokka@1.13, which is the location of the conda environment containing Prokka).
3.4. Diagnosing the problem
All of this information could be useful to figure out the underlying issue for this IRIDA pipeline. In this case, from the Prokka error message:
[tbl2asn] This copy of tbl2asn is more than a year old. Please download the current version.
This is likely the Prokka tbl2asn out of date issue. Solving this requires updating tbl2asn used by Prokka, which will be located under the conda environment (which you can find from the job details information above, in this case it’s /export/tool_deps/_conda/envs/__prokka@1.13).
Alternatively, if you are using a cluster scheduler to schedule jobs, you may wish to view information from this scheduler for this job. The id to use should be located in the job details information (id 50 shown above). Using this information, you could log into your cluster and run:
sacct -j 50 --format="jobid,jobname%20,maxrss,maxrssnode,ntasks,elapsed,state,exitcode"
       JobID              JobName     MaxRSS MaxRSSNode   NTasks    Elapsed      State ExitCode
------------ -------------------- ---------- ---------- -------- ---------- ---------- --------
          50           g46_prokka                                  00:01:19  COMPLETED      0:0
    50.batch                batch     25128K     node-5        1   00:01:19  COMPLETED      0:0
Here, sacct is a command that comes with slurm and lets you look up information about a job run on the cluster (specified as -j 50). The --format= option specifies what information to print (e.g., JobID and JobName). The jobname%20 specifies that the JobName column should be 20 characters wide (useful for printing longer names). The MaxRSSNode tells you the cluster node the job executed on that used the maximum RSS (Resident Set Size, memory used by software). See documentation about your cluster scheduler for more information.
4. Viewing additional Galaxy job information
If the instructions for (3) do not lead to a solution, there are additional files you can check in Galaxy to help diagnose an issue.
4.1. Galaxy log files
The Galaxy log files are one possible source of additional information as to what went wrong with an analysis pipeline in IRIDA. These are often located in the files galaxy/*.log but this depends a lot on your specific Galaxy setup.
Looking through these log files at around the time of the pipeline error can give you clues as to what went wrong. For example:
galaxy.jobs.runners.drmaa DEBUG 2019-07-30 15:14:49,863 (3362/3363) state change: job finished normally
galaxy.jobs.output_checker INFO 2019-07-30 15:14:49,934 Job 3362: Fatal error: Exit code 2 ()
galaxy.jobs.output_checker DEBUG 2019-07-30 15:14:49,934 Tool exit code indicates an error, failing job.
galaxy.jobs.output_checker DEBUG 2019-07-30 15:14:49,934 job failed, standard error is - [Fatal error: Exit code 2 ()
/tool_deps/_conda/envs/__refseq_masher@0.1.1/lib/python3.6/importlib/_bootstrap.py:219: RuntimeWarning: numpy.dtype size changed, may indicate binary incompatibility. Expected 96, got 88
  return f(*args, **kwds)
2019-07-30 15:14:46,399 WARNING: which exited with non-zero code 1 with command "which mash" [in /tool_deps/_conda/envs/__refseq_masher@0.1.1/lib/python3.6/site-packages/refseq_masher/utils.py:44]
2019-07-30 15:14:46,399 WARNING:  [in /tool_deps/_conda/envs/__refseq_masher@0.1.1/lib/python3.6/site-packages/refseq_masher/utils.py:45]
Usage: refseq_masher contains [OPTIONS] INPUT...

Error: Invalid value for "--mash-bin": Mash does not exist at "mash". Please install Mash to your $PATH
]
These messages indicates that for Galaxy Job 3362 failed with an error. The standard error contains messages WARNING: which exited with non-zero code 1 with command "which mash" [in /tool_deps/_conda/envs/__refseq_masher@0.1.1. This suggests that the issue is that the mash binary is not available in the conda environment __refseq_masher@0.1.1. So, you could activate this environment and check to see what’s going on. For example:
# First log into Galaxy machine then use commands like below
PATH=/tool_deps/_conda/bin/:$PATH conda activate /tool_deps/_conda/envs/__refseq_masher\@0.1.1/

mash
bash: mash: command not found
Huh!? mash is not found. You could try re-installing mash to this environment (conda install mash) and try the tool again.
4.1.1. Galaxy Job Numbers in log file
When scanning through the log file you will see lines like:
galaxy.jobs.runners.drmaa INFO 2019-07-30 15:14:44,983 (3362) queued as 3363
galaxy.jobs DEBUG 2019-07-30 15:14:44,984 (3362) Persisting job destination (destination id: slurm_cluster)
galaxy.jobs.runners.drmaa DEBUG 2019-07-30 15:14:45,646 (3362/3363) state change: job is running
...
galaxy.jobs.runners.drmaa DEBUG 2019-07-30 15:14:49,863 (3362/3363) state change: job finished normally
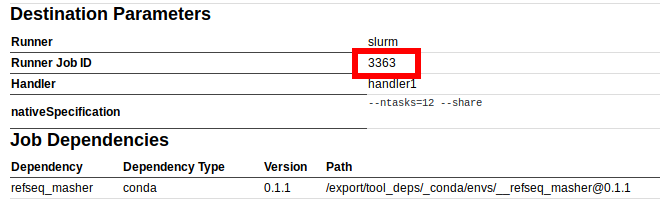
Here, the number 3362 in (3362) or (3362/3363) is the Galaxy Job id, which is also displayed in the information for an individual Galaxy Job in the Galaxy interface:
While the number 3363 in queued as 3363 or (3362/3363) is the cluster/job runner id. This is also displayed in the information for an individual Galaxy Job in the Galaxy interface:
4.2. Galaxy job working directories
For each job that is run in Galaxy, a unique directory is made to store outputs of the job as well as additional information used to run the job. It can sometimes be useful to switch into this directory and explore the contained files to gain more insight about a particular failure.
4.2.1 Galaxy configuration
By default, Galaxy will clean up the files in each job directory after the job finishes, but Galaxy can be configured to keep these files. To determine if this information still exists on your filesystem for you to explore, you will have to check the cleanup_job Galaxy configuration parameter in the config/galaxy.yml file.
cleanup_job: onsuccess
Possible values are always, onsuccess, and never. You will want this to be set to either onsuccess or never, so that Galaxy leaves the job working directories around once the job is completed.
4.2.2. Find Galaxy job working directory parent
To find the Galaxy job working directory, you will have to find the parent directory storing these files. By default, this will be galaxy/database/jobs_directory, but this is configurable with the job_working_directory configuration option in the config/galaxy.yml file.
4.2.3. Find Galaxy job id
You will also need the Galaxy job id, which should be available from the Galaxy interface in the job information page.
In this case, the job id is 3362.
4.2.4. Find Galaxy job working directory
Once you have the Galaxy job id, and the parent to the working directories, you can change into the job working directory using the following pattern of directory names (where 1234 is the job id):
cd database/jobs_directory/001/1234
As another example, with job 3362 the directory should be:
cd database/jobs_directory/003/3362
For longer job ids (such as 1234567) there may be more intermediate directories. For example:
cd database/jobs_directory/001/234/1234567
4.2.5. Examine job working directory files
Once inside the job working directory there are a number of files that may be useful to examine.
4.2.5.1. Standard out/error
These files are named galaxy_[JOBID].o and galaxy_[JOBID].e. These should also be available from the Galaxy interface (in the job information page), but can also be inspected here. For example:
cat galaxy_3362.e
/tool_deps/_conda/envs/__refseq_masher@0.1.1/lib/python3.6/importlib/_bootstrap.py:219: RuntimeWarning: numpy.dtype size changed, may indicate binary incompatibility. Expected 96, got 88
  return f(*args, **kwds)
2019-07-30 18:29:31,832 WARNING: which exited with non-zero code 1 with command "which mash" [in /tool_deps/_conda/envs/__refseq_masher@0.1.1/lib/python3.6/site-packages/refseq_masher/utils.py:44]
2019-07-30 18:29:31,832 WARNING:  [in /tool_deps/_conda/envs/__refseq_masher@0.1.1/lib/python3.6/site-packages/refseq_masher/utils.py:45]
Usage: refseq_masher contains [OPTIONS] INPUT...

Error: Invalid value for "--mash-bin": Mash does not exist at "mash". Please install Mash to your $PATH
4.2.5.2. The working directory
This directory is the current working directory of the tool when it’s run in Galaxy. It may contain temporary files, or input/output files that were actively being used by the job.
ls working/
conda_activate.log  SRR1952908_1.fastq  SRR1952908_2.fastq
4.2.5.3. Galaxy and tool scripts
These are the files that get submitted to a cluster/executed by Galaxy on your machine.
-
galaxy_[JOBID].shThe main script submitted by Galaxy to your cluster.
-
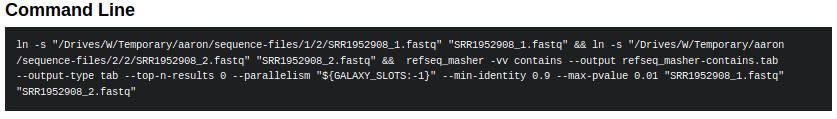
tool_script.shThe actual file which loads up the environment for your tools and runs the tools. This file should contain the command that is printed by the Galaxy interface as the command-line used to execute the tool.
-
Others
Other files contain information relating to the machine the tool executed on (memory and cpu info) as well as additional Galaxy files.
5. Rerunning Galaxy jobs
Sometimes it can be useful to rerun a Galaxy job that has failed previously to see if the error is reproducible. This can be accomplished through two ways: the Galaxy user interface (UI) or the command-line.
5.1. Rerunning jobs in Galaxy UI
To rerun jobs from the Galaxy UI, you will first have to log into Galaxy and find the appropriate history for the IRIDA analysis pipeline (see section (2) for details).
Once you have the Galaxy History in front of you, you can find the errored job and click the rerun job icon. All the parameters should be defaulted to the same as what the job was initially run with:
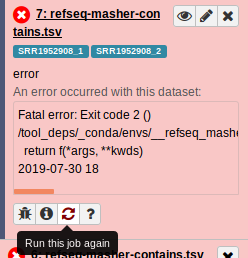
What you should check for when rerunning the job is whether the error is reproducible, or perhaps there is a different error now showing up.
5.2. Rerunning jobs from command-line
DANGER: Using the instructions in this method (rerunning the tool_script.sh file) will overwrite the previously generated files by this tool in Galaxy. Please only do this for tools that have errored and where you are certain you do not need previously-generated output files.
Use this method only as a last resort and at your own risk.
If rerunning from the Galaxy UI does not give any clues as to what’s going on, as a last resort you can also rerun from the command-line using the same environment as what Galaxy used to load tool dependencies.
To do this, first find and change to the job working directory (as described in section (4.2)). For example, for job id 3362 we would change to:
cd database/jobs_directory/003/3362
Now, in here lets look at the tool_script.sh file:
#!/bin/bash
...

. /export/tool_deps/_conda/bin/activate '/export/tool_deps/_conda/envs/__refseq_masher@0.1.1' > conda_activate.log 2>&1
...

ln -s "/irida/sequence-files/1/2/SRR1952908_1.fastq" "SRR1952908_1.fastq" && ln -s "/irida/sequence-files/2/2/SRR1952908_2.fastq" "SRR1952908_2.fastq" &&  refseq_masher -vv contains --output refseq_masher-contains.tab --output-type tab --top-n-results 0 --parallelism "${GALAXY_SLOTS:-1}" --min-identity 0.9 --max-pvalue 0.01 "SRR1952908_1.fastq" "SRR1952908_2.fastq"
This file first tries to load up the tool dependencies (. /export/tool_deps/_conda/bin/activate ...). Then, this runs the actual command to produce the results.
If you are on a machine that has access to the same conda environment (has access to /export/tool_deps/_conda/bin/activate ...), then you could try executing this script yourself (or parts of this script).
tool_script.sh
This could help give you insight into exactly why the specific tool is failing. However, you may have to modify the script to get it to work properly.
DANGER: Running tool_script.sh will overwrite previously generated files by this Galaxy job. Please only do this on jobs you are certain you do not need the output files.
6. Examples
To tie everything together, let’s work through troubleshooting a few example pipeline errors in IRIDA.
6.1. Assembly and Annotation Pipeline tbl2asn error
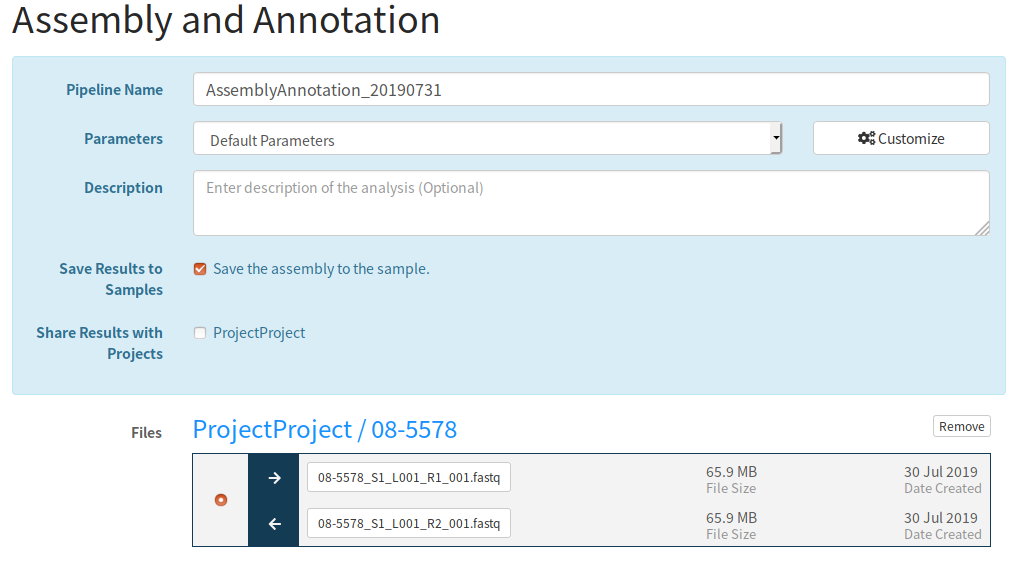
6.1.1. Input data
I submitted the data from the IRIDA Sample Data download. Specifically, a sample created samples from the fastq files in miseq-run/Data/Intensities/BaseCalls/08-5578*.fastq.gz.
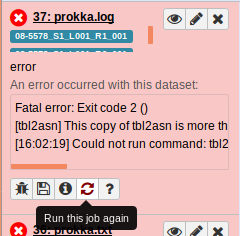
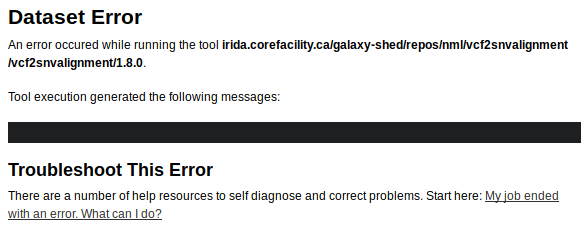
6.1.2. Pipeline error
After a while of running, the pipeline encountered an error:
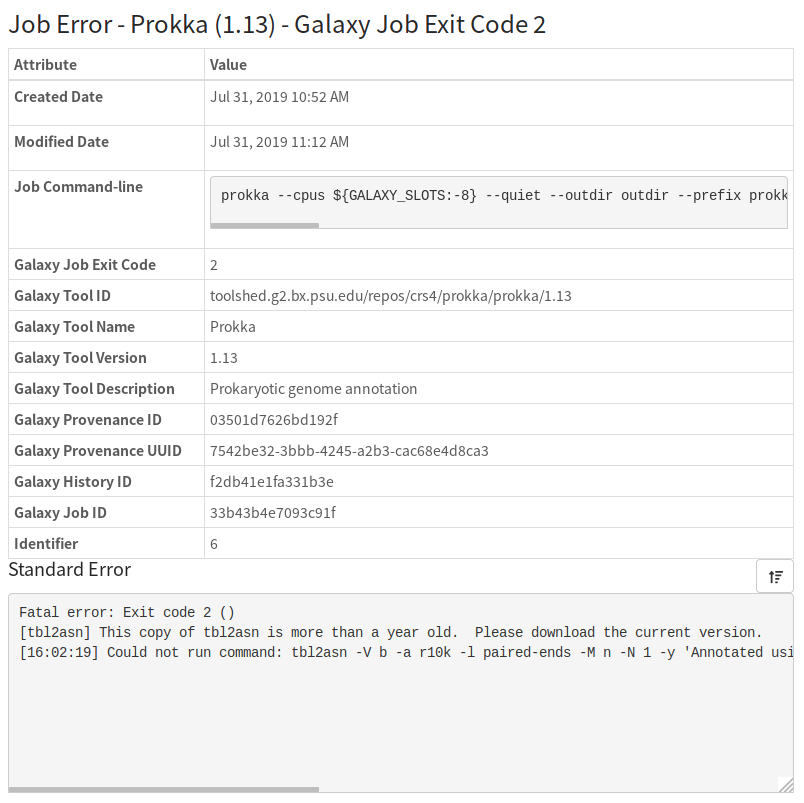
This error gives us a lot of information as to what went wrong. In particular, we will likely have to update the tbl2asn software used by prokka (see the Prokka and tbl2asn section for more details).
6.1.2. Find Galaxy History and Prokka dependencies location
To replace tbl2asn we’ll first need to know where it’s located in the Galaxy file system. To do this we’ll need to find the Galaxy History used by this IRIDA pipeline. Luckily, this information is reported by IRIDA:
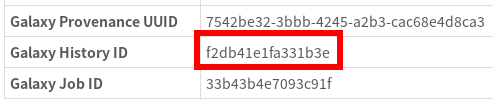
So, let’s go to this Galaxy History by using the URL http://GALAXY_URL/histories/view?id=f2db41e1fa331b3e. This shows us:
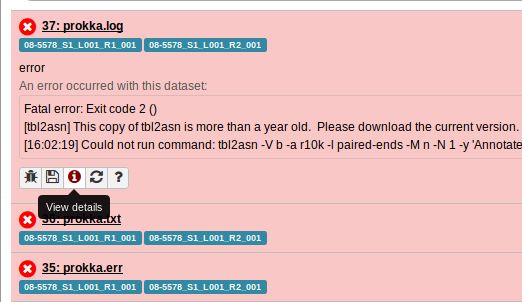
Clicking on the View details page for one of the failed Prokka jobs gives us:

So, from this we can see that the Prokka dependencies location is:
/export/tool_deps/_conda/envs/__prokka@1.13
6.1.3. Replace tbl2asn
Lets now log into Galaxy, and following the instructions in the Prokka and tbl2asn section let’s update tbl2asn.
# Log into Galaxy
# Change to Prokka environment
cd /export/tool_deps/_conda/envs/__prokka@1.13

# Find `tbl2asn` binary
find -iname 'tbl2asn'
./bin/tbl2asn
So, tbl2asn is located in ./bin/tbl2asn. This is the file we have to replace with the file from ftp://ftp.ncbi.nih.gov/toolbox/ncbi_tools/converters/by_program/tbl2asn/.
wget ftp://ftp.ncbi.nih.gov/toolbox/ncbi_tools/converters/by_program/tbl2asn/linux64.tbl2asn.gz
gunzip linux64.tbl2asn.gz
cp linux64.tbl2asn ./bin/tbl2asn
6.1.4. Rerunning Prokka in Galaxy
Now that we’ve replaced it, lets try rerunning Prokka in Galaxy.
First, lets switch to the Galaxy History by going back the the History (http://GALAXY_URL/histories/view?id=f2db41e1fa331b3e) and clicking Switch to this history:

From here, let’s rerun the Prokka tool:
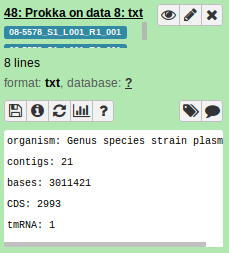
Awesome. It looks like it’s all working now:
6.2. SNVPhyl Pipeline SNV density filtering error
6.2.1. Input data
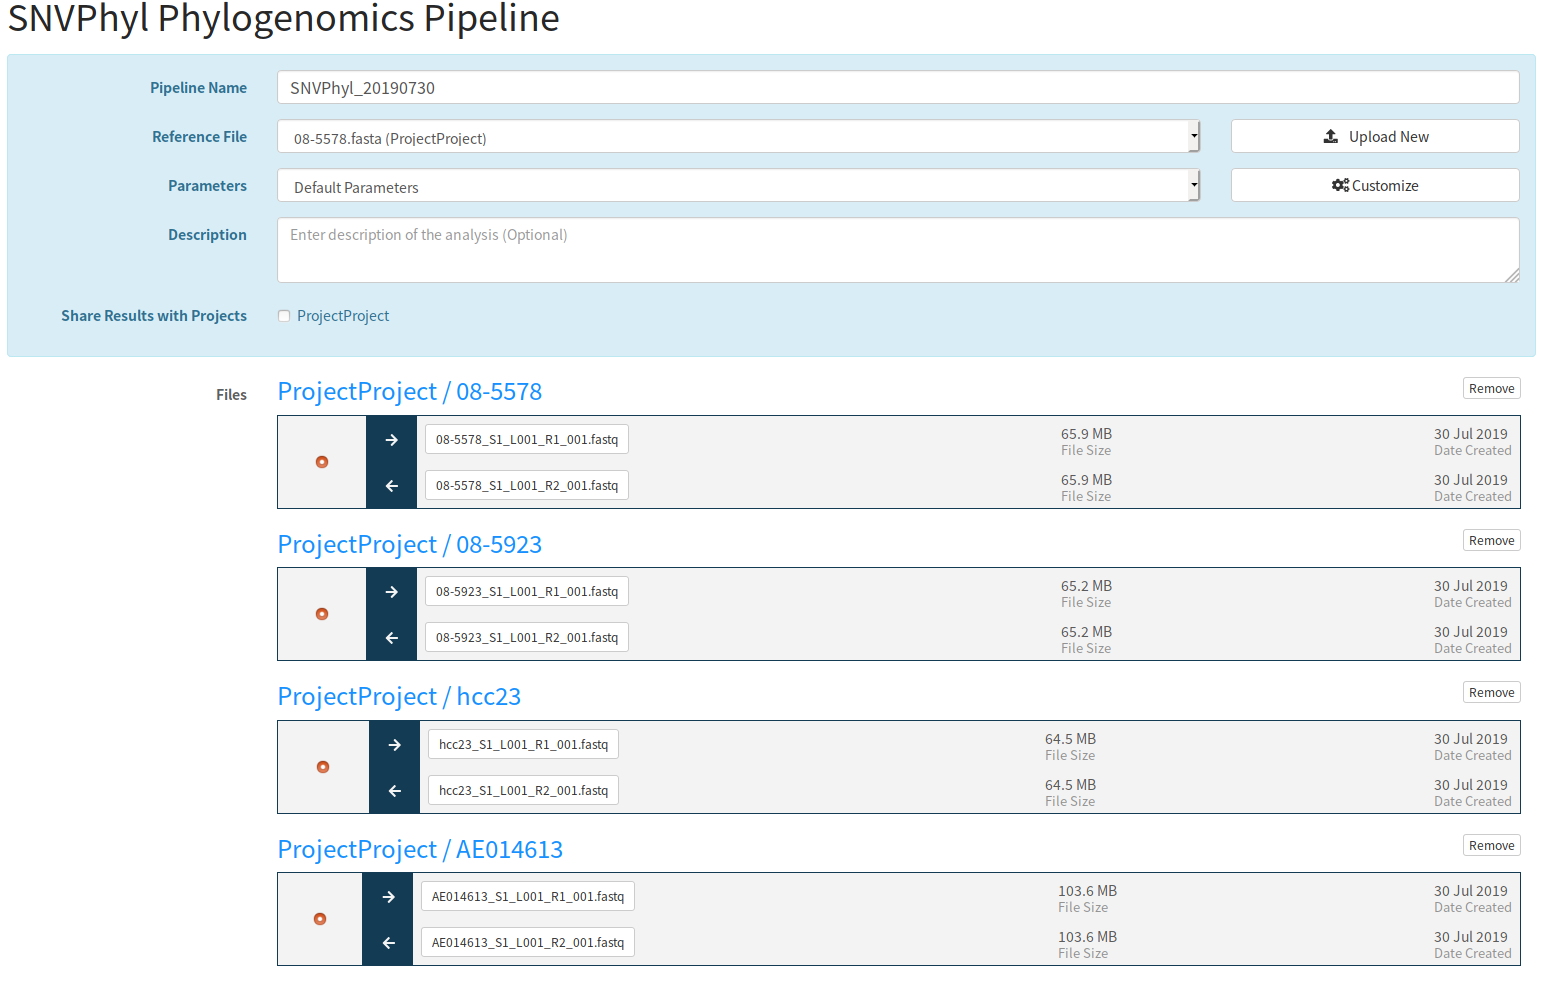
I submitted the data from the IRIDA Sample Data download. Specifically, samples from the fastq files in miseq-run/Data/Intensities/BaseCalls/, and in miseq-run-salmonella/. The reference genome is references/08-5578.fasta. I ran this through SNVPhyl with the default parameters:
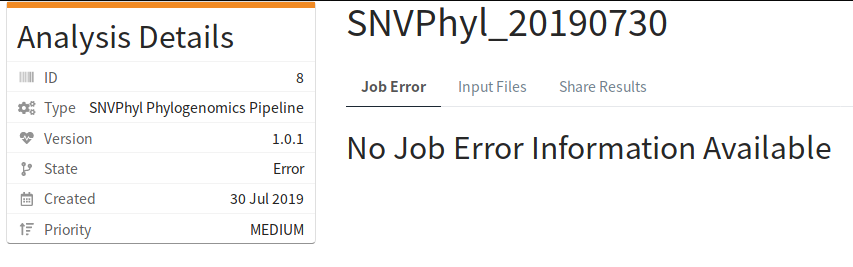
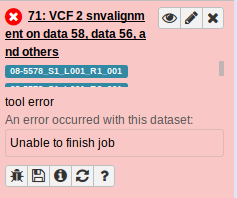
6.2.2. Pipeline error
After a while of running, the pipeline encountered an error:
The IRIDA log file contained:
30 Jul 2019 15:15:49,913 ERROR ca.corefacility.bioinformatics.irida.service.impl.AnalysisExecutionScheduledTaskImpl:269 - Workflow for analysis AnalysisSubmission [id=8, name=SNVPhyl_20190730, submitter=admin, workflowId=b7c8b437-3c41-485e-92e5-72b67e37959f, analysisState=RUNNING,
analysisCleanedState=NOT_CLEANED] in error state WorkflowStatus [state=error, percentComplete=0.85]
30 Jul 2019 15:15:50,278 ERROR ca.corefacility.bioinformatics.irida.service.impl.AnalysisExecutionScheduledTaskImpl:175 - Error checking state for AnalysisSubmission [id=8, name=SNVPhyl_20190730, submitter=admin, workflowId=b7c8b437-3c41-485e-92e5-72b67e37959f, analysisState=ERROR, analysisCleanedState=NOT_CLEANED]
java.lang.NullPointerException
        at ca.corefacility.bioinformatics.irida.model.workflow.analysis.JobError.<init>(JobError.java:164)
        at ca.corefacility.bioinformatics.irida.pipeline.upload.galaxy.GalaxyJobErrorsService.createNewJobErrors(GalaxyJobErrorsService.java:60)
        at ca.corefacility.bioinformatics.irida.service.impl.AnalysisExecutionScheduledTaskImpl.handleJobErrors(AnalysisExecutionScheduledTaskImpl.java:195)
        at ca.corefacility.bioinformatics.irida.service.impl.AnalysisExecutionScheduledTaskImpl.handleWorkflowStatus(AnalysisExecutionScheduledTaskImpl.java:272)
        at ca.corefacility.bioinformatics.irida.service.impl.AnalysisExecutionScheduledTaskImpl.monitorRunningAnalyses(AnalysisExecutionScheduledTaskImpl.java:173)
        at ca.corefacility.bioinformatics.irida.config.services.scheduled.AnalysisScheduledTaskConfig.monitorRunningAnalyses(AnalysisScheduledTaskConfig.java:86)
        at sun.reflect.GeneratedMethodAccessor561.invoke(Unknown Source)
        at sun.reflect.DelegatingMethodAccessorImpl.invoke(DelegatingMethodAccessorImpl.java:43)
        at java.lang.reflect.Method.invoke(Method.java:498)
        at org.springframework.scheduling.support.ScheduledMethodRunnable.run(ScheduledMethodRunnable.java:65)
        at org.springframework.scheduling.support.DelegatingErrorHandlingRunnable.run(DelegatingErrorHandlingRunnable.java:54)
        at org.springframework.security.concurrent.DelegatingSecurityContextRunnable.run(DelegatingSecurityContextRunnable.java:80)
        at java.util.concurrent.Executors$RunnableAdapter.call(Executors.java:511)
        at java.util.concurrent.FutureTask.runAndReset(FutureTask.java:308)
        at java.util.concurrent.ScheduledThreadPoolExecutor$ScheduledFutureTask.access$301(ScheduledThreadPoolExecutor.java:180)
        at java.util.concurrent.ScheduledThreadPoolExecutor$ScheduledFutureTask.run(ScheduledThreadPoolExecutor.java:294)
        at java.util.concurrent.ThreadPoolExecutor.runWorker(ThreadPoolExecutor.java:1149)
        at java.util.concurrent.ThreadPoolExecutor$Worker.run(ThreadPoolExecutor.java:624)
        at java.lang.Thread.run(Thread.java:748)
6.2.3. Getting the Galaxy History id
First, lets check the Galaxy History used by this analysis pipeline. This pipeline errored without a specific message for an individual tool. So, to get the Galaxy History id we’ll have to check the database. See section (2.2) for more details.
We get the IRIDA analysis id from the analysis page which is analysis id 8 (shown above). Using this, we can get the Galaxy History id using a query to the IRIDA database:
SELECT id,name,analysis_state,remote_analysis_id FROM analysis_submission WHERE id = 8;
+----+------------------+----------------+--------------------+
| id | name             | analysis_state | remote_analysis_id |
+----+------------------+----------------+--------------------+
|  8 | SNVPhyl_20190730 | ERROR          | 230ca48747e433cc   |
+----+------------------+----------------+--------------------+
So, the History id is 230ca48747e433cc.
6.2.4. View Galaxy History
Lets use this History id to log into Galaxy and view the History. We do this by navigating to http://GALAXY_URL/histories/view?id=230ca48747e433cc. This shows us:
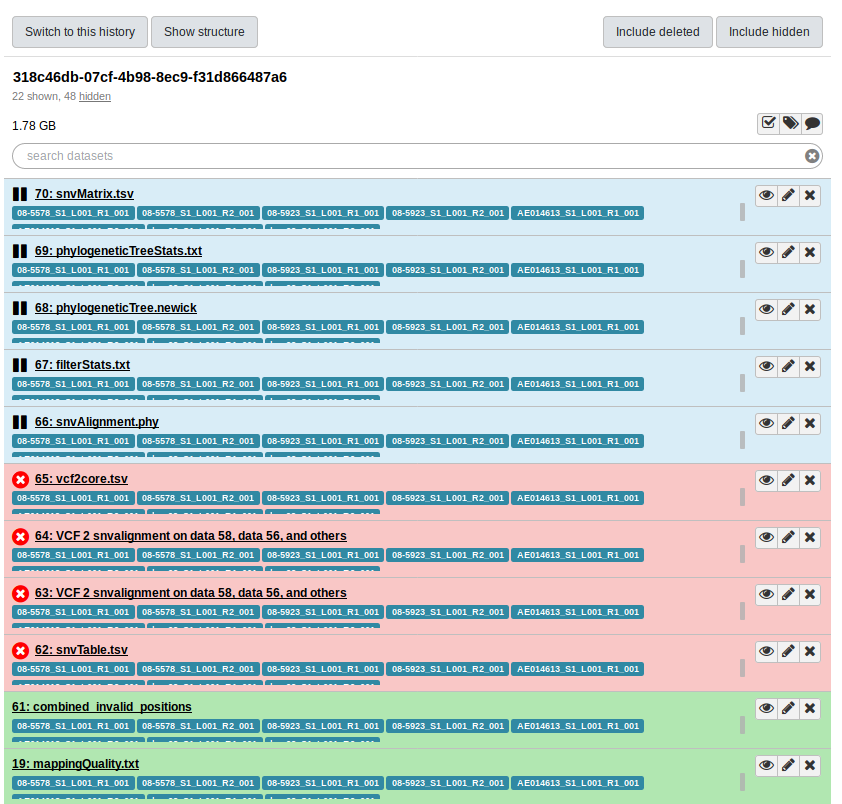
So, the error was at the snvTable.tsv stage of the pipeline. But, looking for more details in the Galaxy UI doesn’t get us anywhere:
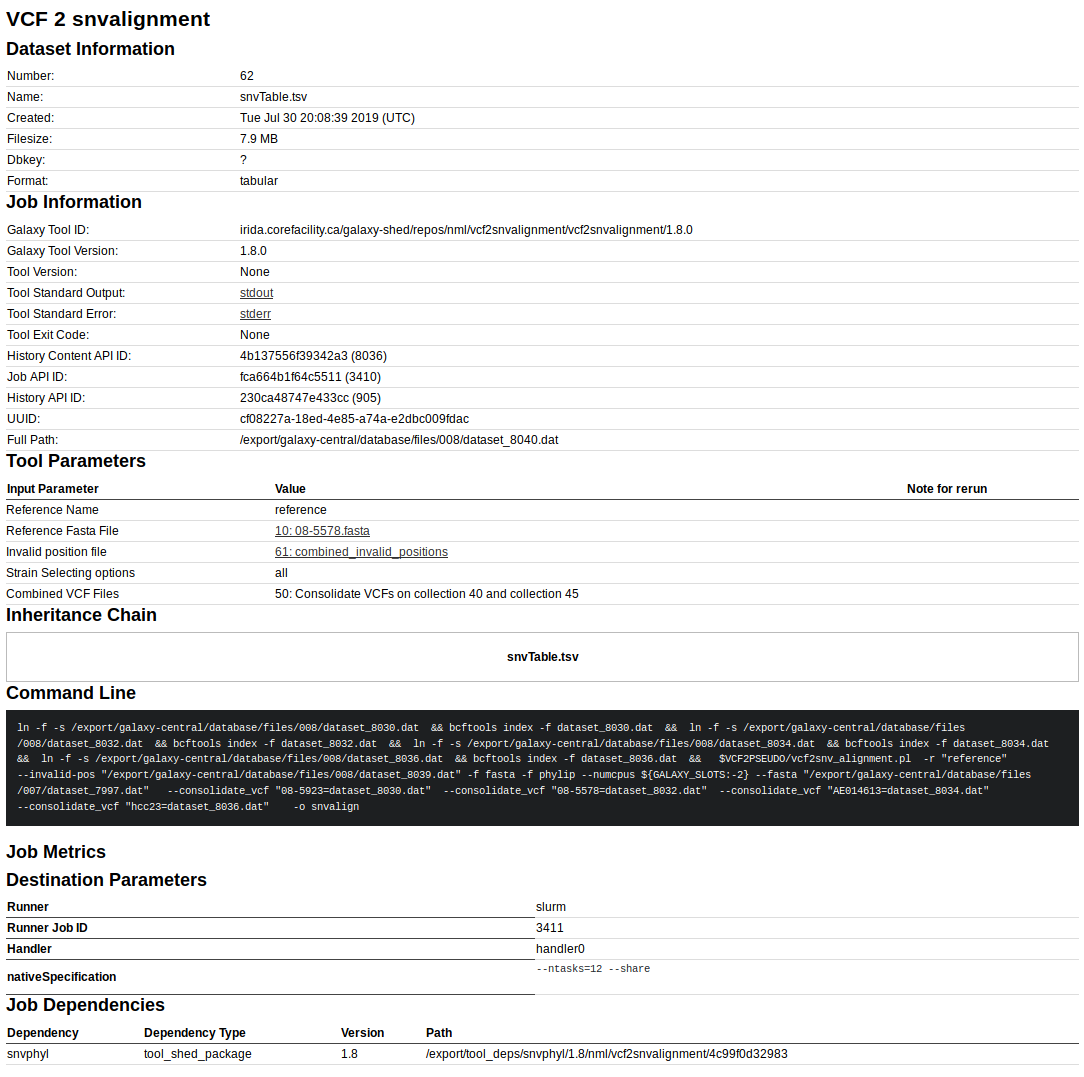
Looking at the job information for the errored tool gives us a lot more details, but still nothing really stands out.
6.2.5. Rerun failed Galaxy job
Just in case this was a random error, lets try rerunning the job that failed in Galaxy.
First, let’s switch to the Galaxy history by clicking the Switch to this history button:
Now let’s rerun the failed job:
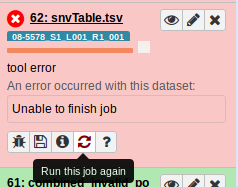
Nope, same issue:
6.2.6. Examine job working directory
Lets examine the job working directory to see if there are anymore hints as to why the job failed.
First, lets get the job id from the Galaxy job information:
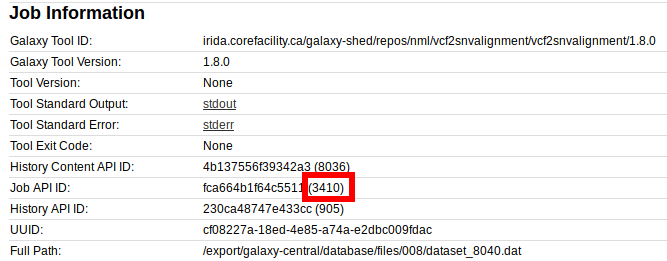
We have a job id of 3410 here. So, lets change into that directory on the Galaxy machine.
# Log into Galaxy machine

cd galaxy/database/jobs_directory/003/3410
ls -1
galaxy_3410.e
galaxy_3410.ec
galaxy_3410.o
galaxy_3410.sh
...
tool_script.sh
working
Lets look at the stderr galaxy_3410.e.
Alignment written to snvalign.fasta
Alignment written to snvalign.phy
So, there’s actual text here. Lets also look at stdout galaxy_3410.o.
/tool_deps/snvphyl/1.8/nml/package_snvphyl_1_8/a27110fb7e55/snvphyl/positions2snv_alignment.pl -i snvalign-positions.tsv -f fasta --reference-name reference -o snvalign.fasta
Date: Tue Jul 30 20:15:28 UTC 2019
Working on snvalign-positions.tsv
No valid positions were found. Not creating empty alignment file
/tool_deps/snvphyl/1.8/nml/package_snvphyl_1_8/a27110fb7e55/snvphyl/positions2snv_alignment.pl -i snvalign-positions.tsv -f phylip --reference-name reference -o snvalign.phy
Date: Tue Jul 30 20:15:29 UTC 2019
Working on snvalign-positions.tsv
No valid positions were found. Not creating empty alignment file
So, this looks like a lot more information. It looks like No valid positions were found is a likely source of the error.
To get more information, let’s look at the intermediate files produced by the tool in the working/ directory.
ls working/ -1
dataset_8030.dat
dataset_8030.dat.csi
dataset_8032.dat
dataset_8032.dat.csi
dataset_8034.dat
dataset_8034.dat.csi
dataset_8036.dat
dataset_8036.dat.csi
snvalign-positions.tsv
snvalign-stats.csv
The files snvalign-positions.tsv and snvalign-stats.csv would be some of the partial results written by this Galaxy tools. Lets look at this:
# `cut` cuts out certain columns from this file
# `column` lines up these columns when printing the output
cut -f 1,6 working/snvalign-stats.csv | column -s$'\t' -t
#Reference name                Percentage of valid and included positions in core genome
gi|662858600|ref|NC_013766.2|  0.00
all                            0.00
The number 0.00 tells us that 0.00% of positions were considered as valid by SNVPhyl, which means SNVPhyl will not produce a valid alignment of SNVs. This would explain the message No valid positions were found. Not creating empty alignment file.
Note: for more details on interpreting these files, please see the SNVPhyl Documentation.
Let’s take a quick look at the working/snvalign-positions.tsv file:
head working/snvalign-positions.tsv | column -s$'\t' -t
#Chromosome                    Position  Status            Reference  08-5578  08-5923  AE014613  hcc23
gi|662858600|ref|NC_013766.2|  73        filtered-invalid  T          -        -        -         A
gi|662858600|ref|NC_013766.2|  78        filtered-invalid  A          -        -        -         T
gi|662858600|ref|NC_013766.2|  80        filtered-invalid  G          -        -        -         A
gi|662858600|ref|NC_013766.2|  88        filtered-invalid  C          -        -        -         A
gi|662858600|ref|NC_013766.2|  90        filtered-invalid  G          -        -        -         C
gi|662858600|ref|NC_013766.2|  109       filtered-invalid  A          -        -        -         G
gi|662858600|ref|NC_013766.2|  111       filtered-invalid  G          -        -        -         A
gi|662858600|ref|NC_013766.2|  128       filtered-invalid  C          -        -        -         A
gi|662858600|ref|NC_013766.2|  170       filtered-invalid  T          -        -        -         A
It looks like some SNV positions were identified, but they likely all have the status of filtered-invalid. We can verify this with:
# Prints lines not containing 'filtered'
grep -v 'filtered' working/snvalign-positions.tsv
#Chromosome Position Status Reference 08-5578 08-5923 AE014613 hcc23
So, no lines (outside of the header line) contain the text filtered, so no valid SNVs were identified.
6.2.7. Testing out a solution
Examining the files in the Galaxy job working directory led us to the conclusion that no valid SNVs were identified by SNVPhyl, and so the Galaxy job building the alignment of SNVs failed.
A common cause for this issue is that the SNV density filtering thresholds are too high (default is to remove regions where there are at 2 or more SNVs in a 500 bp window).
These can be adjusted in the parameters used by SNVPhyl:
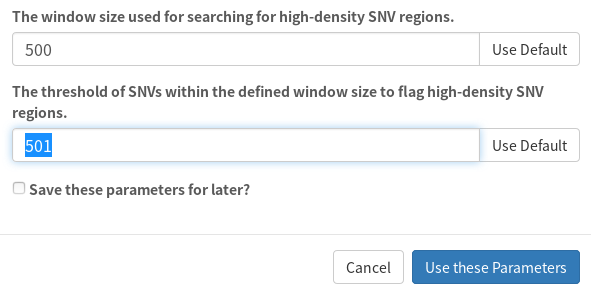
Here, I adjusted the SNV density threshold of 501 to be greater than the window size (500).
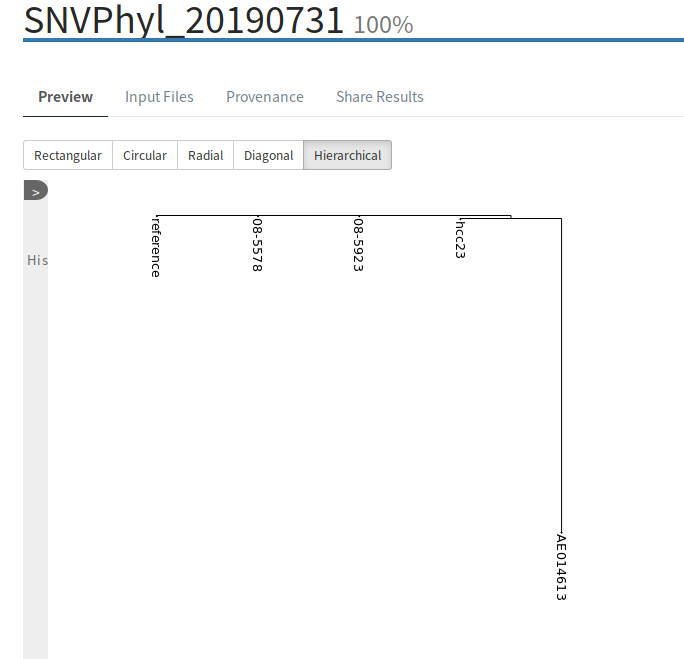
Rerunning the pipeline with these parameters results in a successful execution:
6.3. IRIDA Analysis Pipeline that runs forever
Lets imagine a scenario where a pipeline has started running, but never completes. It appears to be stuck in the RUNNING stage.

So, lets take a look at what’s going on.
6.3.1. Find Galaxy History
Since the pipeline is still running, there is no Galaxy History id displayed in the IRIDA interface. So, you must log into the IRIDA database to find the History id.
For this analysis pipeline, the IRIDA id is 468, so to find the Galaxy History id, we run the query:
SELECT id,name,analysis_state,remote_analysis_id FROM analysis_submission WHERE id = 468;
+-----+-------------------------------+----------------+--------------------+
| id  | name                          | analysis_state | remote_analysis_id |
+-----+-------------------------------+----------------+--------------------+
| 468 | SISTRTyping_20190731_SH10-001 | RUNNING        | c85e859df31e0b2b   |
+-----+-------------------------------+----------------+--------------------+
The Galaxy History id is in the column remote_analysis_id which is c85e859df31e0b2b.
We can use this to go to the History in Galaxy by navigating to http://GALAXY_URL/histories/view?id=c85e859df31e0b2b. This shows us:
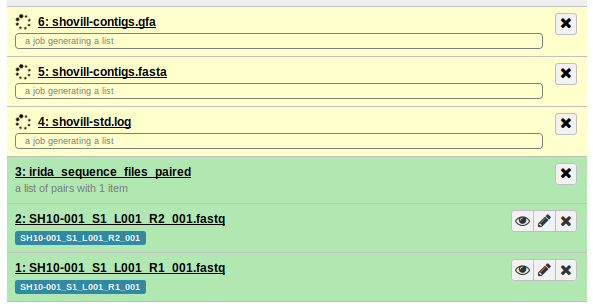
So, it looks like it’s the shovill stage (genome assembly) which is stuck and not completing.
6.3.2. Cluster/SLURM job info
Lets look into more details on the job that was scheduled to the cluster (using SLURM).
First, we must get the Galaxy Job ID, which can be found in the job info page:
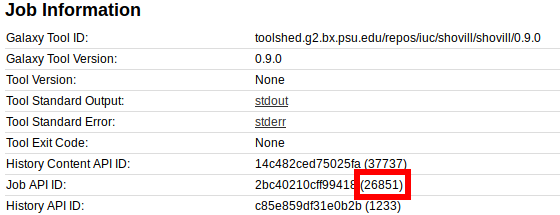
From here, we can find the Job API ID of 26851.
When running through this tutorial, I could not see the SLURM job id, so we’ll have to find this out another way using the Galaxy Job API ID.
We can log into the cluster and run the SLURM command:
squeue -a --format="%.10i %.20j %.15u %.8T %.10M %.6D %R %C %m" | grep 26851
7791919 g26851_shovill_workf galaxy-irida RUNNING 2-03:07 1 node-2 8 24G
Lining this up and including the header for this info gives us:
JOBID    NAME                  USER          STATE    TIME     NODES  NODELIST(REASON)  CPUS  MIN_MEMORY
7791919  g26851_shovill_workf  galaxy-irida  RUNNING  2-03:07  1      node-2            8     24G
So, the command squeue prints information about active jobs in the SLURM queue (--format is used to choose the information to display). We then use grep 26851 to search for the Galaxy Job ID, which is printed as part of the NAME of the job running with SLURM (which is not the SLURM JOBID).
Note: If this does not work because the Galaxy Job ID does not display as part of the NAME, you could also use something like grep '(26851) queued as' galaxy/*.log in the Galaxy log files, which should print a line like (26851) queued as 7791919 showing you exactly what the SLURM job id is.
Coming back to the SLURM job information we just printed, you can see that the TIME is listed as 2 days 3 hours and 7 minutes. This is way too long for the tool shovill, so something has gone wrong.
6.3.3. Log into cluster node for more details
To figure out what went wrong, lets try logging into the cluster node running the job node-2 and looking for more details.
ssh node-2

ps aux | grep shovill
... shovill --outdir out --cpus 8 --ram 24 --R1 /irida/file_1.fastq --R2 /irida/file_2.fastq ...
This tells us that shovill is running on this machine, but if we run top it shows us that shovill nor any of its dependencies are running (0% CPU usage). So, something strange is going on here.
6.3.4. Reschedule SLURM job
Lets log out of the cluster node (node-2) running this job and try rescheduling the job on the cluster. To do this, we can just cancel the current job and Galaxy should (if properly configured, see the Galaxy Job Configuration for more information) detect this situation and reschedule shovill on the cluster.
To cancel the current job, we first need the cluster (SLURM) job id, which was displayed as JOBID when running the squeue command in section (6.3.2) above.
JOBID    NAME                  USER          STATE    TIME     NODES  NODELIST(REASON)  CPUS  MIN_MEMORY
7791919  g26851_shovill_workf  galaxy-irida  RUNNING  2-03:07  1      node-2            8     24G
Here, the id is 7791919. So, to cancel the job, we can use the command (required to be run as the same user submitting the Galaxy jobs):
scancel 7791919
You should now see that job 7791919 disappears from the cluster queue, and if Galaxy is configured to detect and resubmit jobs that were cancelled, you should now see a new job scheduled for shovill.
JOBID    NAME                  USER          STATE    TIME  NODES  NODELIST(REASON)  CPUS  MIN_MEMORY
7791962  g26851_shovill_workf  galaxy-irida  RUNNING  0:05  1      node-3            8     24G
If everything is working properly (and if the shovill job error was just a random error) you should eventually see the IRIDA pipeline complete.

6.4. Analysis Pipeline upload timeout
Let us say we have submitted a pipeline and it failed with no job errors:
And say the IRIDA log file contains:
31 Jul 2019 15:03:52,910 ERROR ca.corefacility.bioinformatics.irida.service.analysis.execution.AnalysisExecutionServiceAspect:65 - Error occured for submission: AnalysisSubmission [id=11, name=AssemblyAnnotation_20190731_AE014613, submitter=admin, workflowId=4673cf14-20eb-44e1-986b-ac7714f9a96f, analysisState=SUBMITTING, analysisCleanedState=NOT_CLEANED] changing to state ERROR
ca.corefacility.bioinformatics.irida.exceptions.UploadTimeoutException: Timeout while uploading, time limit = 2 seconds
        at ca.corefacility.bioinformatics.irida.pipeline.upload.galaxy.GalaxyLibrariesService.filesToLibraryWait(GalaxyLibrariesService.java:245)
        at ca.corefacility.bioinformatics.irida.pipeline.upload.galaxy.GalaxyHistoriesService.filesToLibraryToHistory(GalaxyHistoriesService.java:201)
        at ca.corefacility.bioinformatics.irida.service.analysis.workspace.galaxy.AnalysisCollectionServiceGalaxy.uploadSequenceFilesPaired(AnalysisCollectionServiceGalaxy.java:140)
        at ca.corefacility.bioinformatics.irida.service.analysis.workspace.galaxy.AnalysisWorkspaceServiceGalaxy.prepareAnalysisFiles(AnalysisWorkspaceServiceGalaxy.java:231)
        at ca.corefacility.bioinformatics.irida.service.analysis.execution.galaxy.AnalysisExecutionServiceGalaxyAsync.executeAnalysis(AnalysisExecutionServiceGalaxyAsync.java:147)
...
Caused by: java.util.concurrent.TimeoutException
        at java.util.concurrent.FutureTask.get(FutureTask.java:205)
        at ca.corefacility.bioinformatics.irida.pipeline.upload.galaxy.GalaxyLibrariesService.filesToLibraryWait(GalaxyLibrariesService.java:241)
        ... 28 more
Now, this could be caused by too low of a value for the parameter galaxy.library.upload.timeout in the /etc/irida/irida.conf file, in which case you can increase the value and restart IRIDA.
However, if the galaxy.library.upload.timeout value is already set pretty high, there may be some other reason why you are getting this TimeoutException.
6.4.1. Look at Galaxy upload jobs
Before IRIDA schedules a workflow, it must first get data into Galaxy. These are processed by Galaxy to determine the file type and other metadata about the files. These processing tasks are scheduled as jobs in Galaxy and if these jobs do not get scheduled in time by the underlying scheduler (i.e. SLURM), the galaxy.library.upload.timeout may be hit, causing IRIDA to switch this pipeline into an ERROR state.
To look at the Galaxy upload jobs, the first method would be to search for them in your queuing system. For example, with SLURM you could run:
squeue -a --format="%.10i %.20j %.15u %.8T %.10M %.6D %R %C %m" -u galaxy
Here, squeue gives information about the jobs running in SLURM, --format defines what to display, and -u galaxy shows only jobs for the galaxy user (change this value depending on the user running jobs for Galaxy). The results of this command are:
JOBID    NAME                  USER    STATE    TIME  NODES  NODELIST(REASON)  CPUS  MIN_MEMORY
7793214  g26950_upload1_workf  galaxy  PENDING  0:00  1      (None)            1     2G
7793215  g26949_upload1_workf  galaxy  PENDING  0:00  1      (Priority)        1     2G
7793216  g26951_upload1_workf  galaxy  PENDING  0:00  1      (Priority)        1     2G
Here, it looks like there are some Galaxy upload jobs, but they are all in the state PENDING on the cluster. Now may be a good time to check how busy your cluster is:
squeue -a --format="%.10i %.20j %.15u %.8T %.10M %.6D %R %C %m" | grep 'PENDING' -c
500
Hmm… there are 500 jobs in the PENDING state on the cluster (including the 3 upload jobs we have scheduled). This may be the cause of the timeout issues for IRIDA analysis pipelines, that the cluster is too busy.
6.4.2. Solving the issue
Job scheduling priorities on a cluster is very specific for each institution, so we do not have any single solution for this problem. But we do recommend making sure the Galaxy upload jobs are given priority over many other jobs on your cluster if you want IRIDA pipelines (or Galaxy uploads) to be responsive. These jobs should take minimal resources and should only run for at most a few minutes.
Prioritizing jobs on a cluster and adjusting Galaxy job queues are beyond the scope of this guide, but we recommend referring to the Galaxy Cluster and Galaxy Job documentation for more details.